Current ripple measurement.
Measuring current ripple can be useful to understand if the converter is operating correctly. However, it requires an oscilloscope and a special type of probe, making it difficult to achieve.
In this example will use the embedded HAL sensor of the Twist board and multiply its time resolution by 400. To do so we will keep the converter in a stable operating condition and perform a sweep on the current measurement trigger moment. The procedure will be explained in more detail below.
We will work in open loop and at a fixed duty cyle.
Warning
This is a very advanced example. Please take your time to execute it.
Hardware setup and requirement
The circuit diagram of the board is shown in the image below.

The power flows from VHigh to VLow. The wiring diagram is shown in the figure below.

Warning
You will need : - 1 TWIST - A dc power supply (20-60V) - A resistor (or a dc electronic load)
Main Structure
The main.cpp structure is shown in the image below.

The code structure is as follows: - On the top of the code some initialization functions take place. The scope object is created by the line below.
Two support functions are also provided. They allow triggering the scope and dumping its data. - Setup Routine - calls functions that set the hardware and software. It will connect the Channels to the scope, set its trigger, set its delay and start it. Where the voltages and currents ofLEG1 and LEG2, the duty_cycle and the V_HIGH are going to be saved. The delay to apply the trigger is of 20% of all the measurements.
```cpp
    scope.connectChannel(I1_low_value, "I1_low");
    scope.connectChannel(V1_low_value, "V1_low");
    scope.connectChannel(I2_low_value, "I2_low");
    scope.connectChannel(V2_low_value, "V2_low");
    scope.connectChannel(duty_cycle, "duty_cycle");
    scope.connectChannel(V_high, "V_high");
    scope.set_trigger(&a_trigger);
    scope.set_delay(0.2F);
    scope.start();

```
-
Communication Task - Handles the keyboard communication and decides which
MODEis activated. An automatic sweep of the current measurement is performed in this example. To synchronize the scope with it, the trigger is done when calling the power mode, as per the lines below.cpp case 'p': printk("power mode\n"); /* Reset the scope trigger */ scope.start(); mode = POWERMODE; break;However, the sweep must be enabled by using theakey as in the code below.The data from the scope can be retrieved by using the
rkey as in the code below. This also rearms the scope trigger. -
Application Task - Handles the
MODE, activates the LED and prints data on the serial port. It calls the data dump if the trigger retrieve has been activated. -
Critical Task - Handles the
MODE, sets power ON/OFF, it updates theduty_cycleof both legs and it handles the current measurement trigger sweep. The trigger sweep is performed with the following code:if (enable_acq) { trig_ratio += (end_trig_ratio - begin_trig_ratio) / (float32_t)num_trig_ratio_point; /* Make a cycle */ if (trig_ratio > end_trig_ratio) { trig_ratio = begin_trig_ratio; } shield.power.setTriggerValue(LEG1, trig_ratio); }This is followed by the scope acquisition, which is always on whenever the mode is
POWERMODE.
The tasks are executed following the diagram below.

- Communication Task - Is awaken regularly to verify any keyboard activity
- Application Task - This task is woken once its suspend is finished
- Critical Task - This task is driven by the HRTIM count interrupt, where it counts a number of HRTIM switching frequency periods. In this case 100us, or 20 periods of the TWIST board 200kHz switching frequency set by default.
Control diagram
There is no control diagram in this example, the duty cycle is in open-loop.
A PID controller is spawned by default in case you wish to build on this example.
Look under the hood
In this example you will need to dig deeper in the code to properly observe the inductor current.
Change the modulation type.
To rebuild the current waveform, we will use the trig_ratio variable to will peform a sweep on the moment the measurement is done in comparison with the carrier ramp. The image below illustrate how these changes are made for three different measurement instants. Notice the duty cycle is constant.
Warning
By default, the Twist boards operate in the Center_Aligned mode. Its carrier is different as shown in the image below.

As you can see, there are two sides to the carrier, the rising edge or the falling edge. It is not possible to sweep from one to the other.
Thus it is necessary to change the modulation of the Twist board to Lft_aligned.
Find the twist_v1_4_1.overlay file.
To see the file zephyr/boards/shields/twist/twist_v1_4_1.overlay in vscode, you must toggle in Expert Mode.
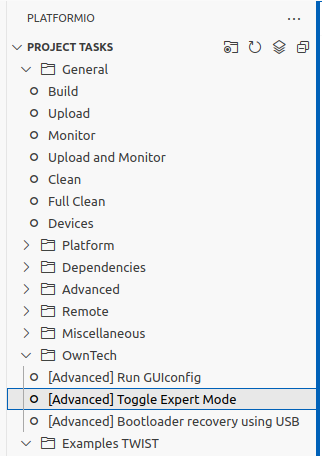
Then you should see the directory tree of zephyr.
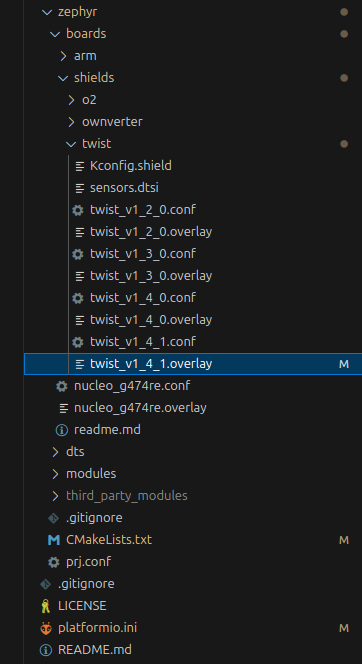
In the zephyr/boards/shields/twist/twist_v1_4_1.overlay, change modulation as shown below:
        leg1: leg1{
            leg-name = "LEG1";
            pwms = <&pwma 1 0>, <&pwma 2 0>;
            pwm-pin-num = <12 14>;
            capa-pin-num = <7>;
            driver-pin-num = <19>;
            current-pin-num = <30>;
            default-adc-trigger = "ADCTRIG_1";
            default-adc-decim = <1>;
            default-edge-trigger = "EdgeTrigger_up";
            default-dead-time = <100 100>;
            // default-modulation = "UpDwn";
            default-modulation = "Lft_aligned";
            default-phase-shift = <0>;
            status = "okay";
        };

        leg2: leg2{
            leg-name = "LEG2";
            pwms = <&pwmc 1 0>, <&pwmc 2 0>;
            pwm-pin-num = <2 4>;
            capa-pin-num = <56>;
            driver-pin-num = <22>;
            current-pin-num = <25>;
            default-adc-trigger = "ADCTRIG_3";
            default-adc-decim = <1>;
            default-edge-trigger = "EdgeTrigger_up";
            default-dead-time = <100 100>;
            //default-modulation = "UpDwn";
            default-modulation = "Lft_aligned";
            default-phase-shift = <0>;
            status = "okay";
        };
Run the example
Build the code and upload it to your Twist board.
Tip
To capture the current ripple you have to follow these steps:
- press the p key to go in POWER_MODE
- press the a key to activate the trigger of the ScopeMimicry instance.
- press the i key to come back in IDLE_MODE
- press the r key to retrieve the data.
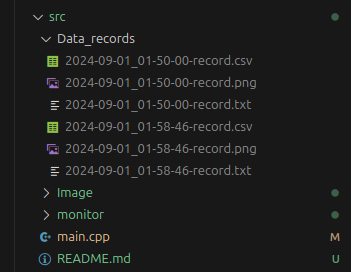
After these steps you should see in your directory a new folder called Data_records appear.
Within it you will find three files with the following naming convention :
Year-month-day-hour-minute-second.txt- a raw data fileYear-month-day-hour-minute-second.csv- a post-treated csv fileYear-month-day-hour-minute-second.png- an automatically generated png file
As an example here are two acquisitions:
In the code there's some parameters you can change:
- num_trig_ration_point: it sets the number of trig_ratio value will be sweep
between begin_trig_ratio and end_trig_ratio
- begin_trig_ratio : beginning value of the sweep.
- end_trig_ratio: end value of the sweep.
Plot the results
Your .png file is used for a quick analysis of the results. For a better experience, you can plot the data using a platformio action.
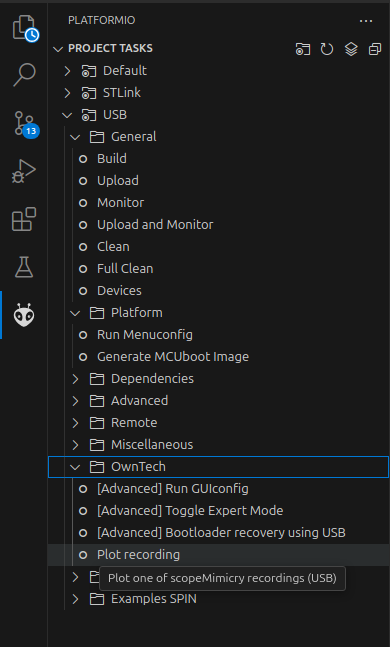
Follow these steps as in the image below:
- Click on the alien
- Click on your environment (in this case USB)
- Click on the owntech folder
- Click on Plot recording
This will prompt you in the terminal to choose your recording:
 *  Executing task: platformio run --target plot-record --environment USB

Processing USB (board: spin; platform: [email protected]; framework: zephyr)
-----------------------------------------------------------------------------------------------------------------------------------------------------------------------------------------------------------------------------------------------
Verbose mode can be enabled via `-v, --verbose` option
'zephyr,console = &lpuart1;' not found in './zephyr/boards/arm/spin/spin.dts'. No replacement performed.
record n°0, name 2024-09-01_01-50-00-record.txt
record n°1, name 2024-09-01_01-58-46-record.txt
Enter record number to plot
1
The record number is: 1
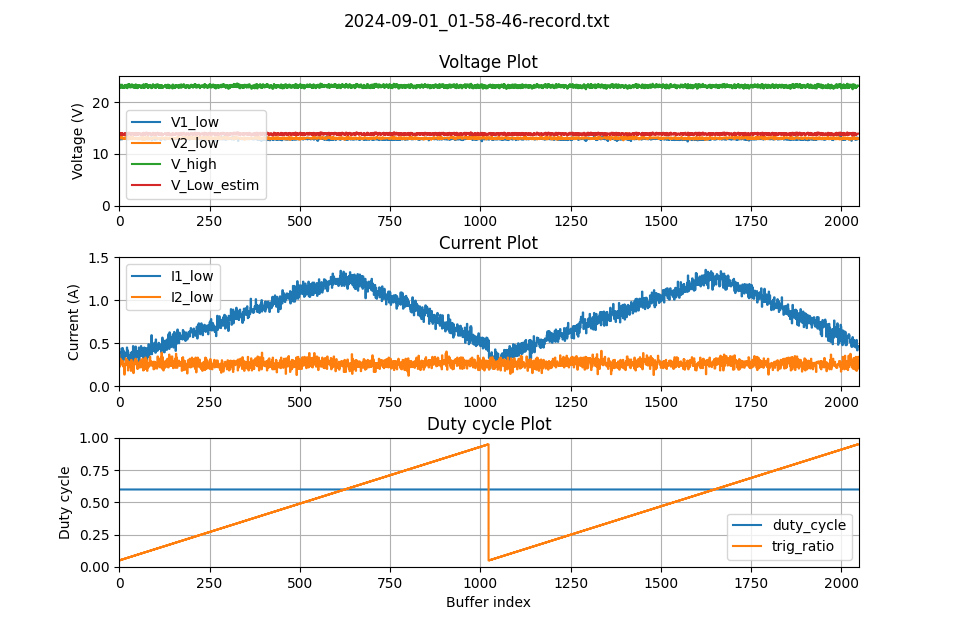
There are three distinct plots:
- Voltage plot: Showing the value of the voltage for LEG1, LEG2, VHIGH and a filtered value.
- Current plot: Showing the value of the current captured by the changes in the trigger ratio.
- Duty cycle plot: Shows the values of the duty cycle and the trig ratio, both between 0 and 1.
This data will be automatically processed and generate a .txt, a .csv and a .png file.
Success
It is possible to see the ripple current in detail. This is the equivalent of two switching periods of the Twist board. From these values it is possible to calculate the ripple to be bewteen 0.4 A and 1.4 A, meaning 1.0 A of ripple.
This is a wave of 200kHz with 1024 points of resolution. This is the equivalent of having a 400MHz sampling rate! With a 1MHz current sensor.